Put simply, Reports allow you to sort, filter, and/or categorize your attendees based on the data they submitted in the registration form for your event.
LaunchTrack customers have used the Reports feature to create reports, lists, and rosters in the following ways:
- Parent/guardian contact lists for coaches
- Segmented email lists to tailor your marketing and announcements
- Check-in lists for camp registrations
- Category-specific name lists for making name tags
- Create groups and teams specific to e.g. player positions
- Evaluate the effectiveness of marketing efforts over time
- Plus more!
To start creating a new report, after logging in find the event you want to create an event for and click the "Reports" button to the right of it.

On the next page, click the "Create Report" button.
A generic Report title will be generated for you automatically (based on the event name and today's date), but you can rename the report by changing the text in the text box. You can also select if you would like the report to be public or not by checking the box. Reports that are public will be assigned a unique URL that can be shared. Anyone with the URL can see the report, making it an ideal way to share registration info.
Further down the page, you can start building your report. The options listed under "Column Selections" are data about your registration (like each registrant's Confirmation #, Status (Registered or Prospect), etc.) and the form fields you had on your registration form.
For example, if this is what your registration form looked like...
Then this is what your Report options would look like. See the similarities?
You can check the checkboxes for the data categories you want included in your report. The "Filter" options on the right are for selecting even more specific data within a category. For example, if I wanted to filter for only people who graduated in the year 1990, I would first check the box next to "Graduation year" and then select "1990" in the Filter menu.
Once you're done selecting the data you want to see, click the "Run Report" button at the bottom of the page to create your custom report.
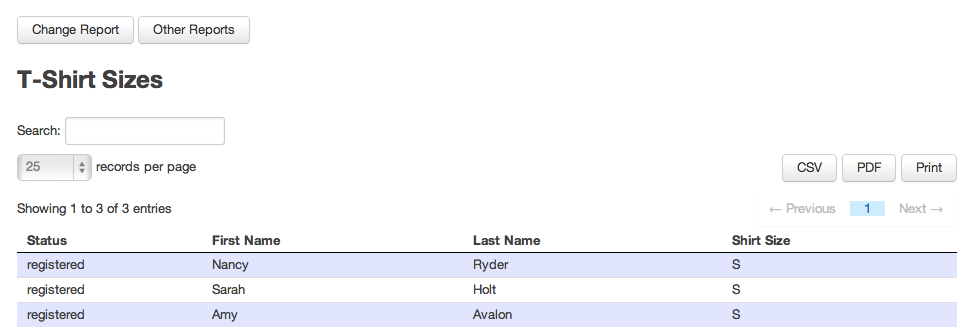
In the example below, I am creating a report for the packet pick-up for a 5K race. This event has volunteers at different tables, where each table is giving out packets based on t-shirt size to streamline the packet pick-up process. I would create a report for each table containing registrants' First Name, Last Name, and T-Shirt Size. In the example below, I have filtered for only the registrants whose Shirt Size is Small (S).

You can export to CSV, PDF, or Print via the buttons on the right. If you'd like to modify your report, you can click the "Change Report" button at the top to add or remove any categories as you wish.
Comments